Two robots,
every year green.
Two audited index-futures strategies — Micro Nasdaq and Micro Russell. The Russell backtest runs 2020 through the COVID crash and the 2022 bear — every year green. And you can re-run both on TradingView yourself.
We even show you the drawdown — the number the others crop out.
Every trade cross-checked on Python ↔ TradingView ↔ TradeStation — 96%+ trade-for-trade match
Most show you the wins.
We show you the drawdown.
The hard part of any strategy isn't the green — it's what you have to sit through to get it. So we put it on screen, in the same frame as the profit.
The drawdown is shown
Every backtest displays its worst peak-to-valley loss — the number most sellers hide. If you can't hold it, you can't earn it.
Tested through two bear markets
2020 COVID crash. 2022 bear. Both inside the backtest window — both years closed green. Not a bull-only track record.
Hard stop · no grid · no repaint
A real stop-loss on every trade, one position at a time (no martingale), signals confirmed on bar close. Nothing to overfit after the fact.
The Nasdaq robot & the Russell robot.
Each was built and validated independently for its own index — then both cleared the same audit: a hard stop on every trade, no grid, no repaint, and a positive year in every one of the last six.
The Nasdaq Robot
The Russell Robot
Hypothetical backtest results · 2020–2026 · 1 contract · commissions included · past performance is not indicative of future results
Not our drawing.
The real backtest.
These are the actual TradingView strategy reports — the exact ones you can re-run yourself the day you get access. One contract, $20,000, deep bar-by-bar fills, commissions & slippage in.
$40,000 grew to $122,786 — every year green, straight through COVID and the 2022 bear. Worst drawdown just 11.2%. Two robots together ride smoother than either one alone.
And here's each robot on its own — the actual TradingView reports, one contract, $20K. Re-run them yourself the day you start.
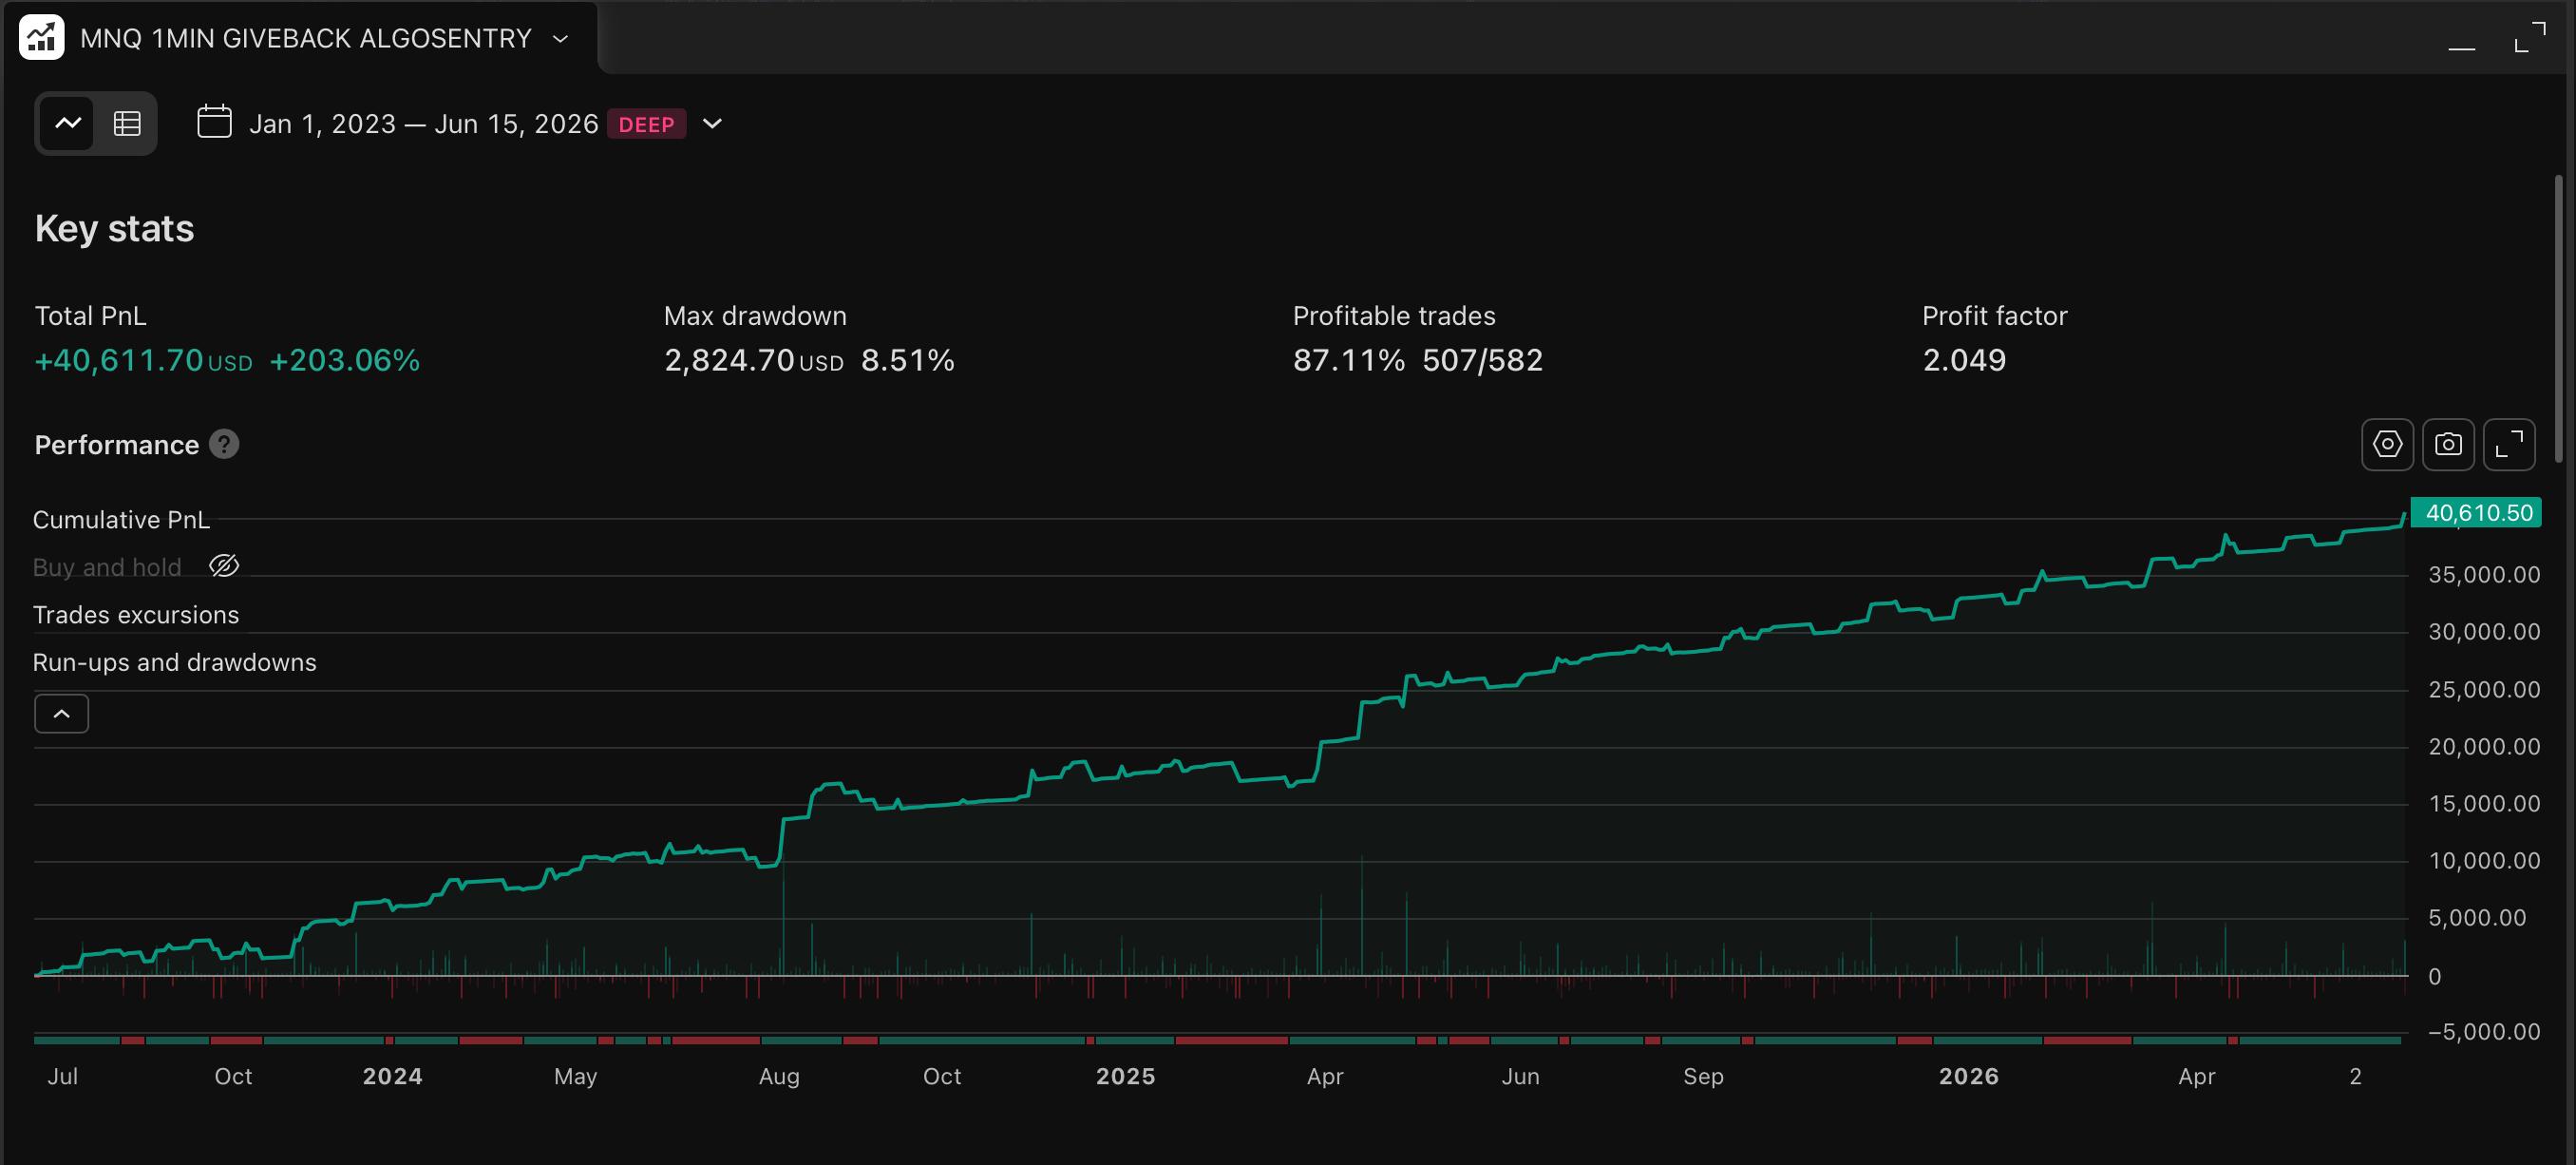
The real TradingView report. 2023–2026 (TradingView's 1-minute history limit), commissions & slippage in, worst drawdown 8.51%.
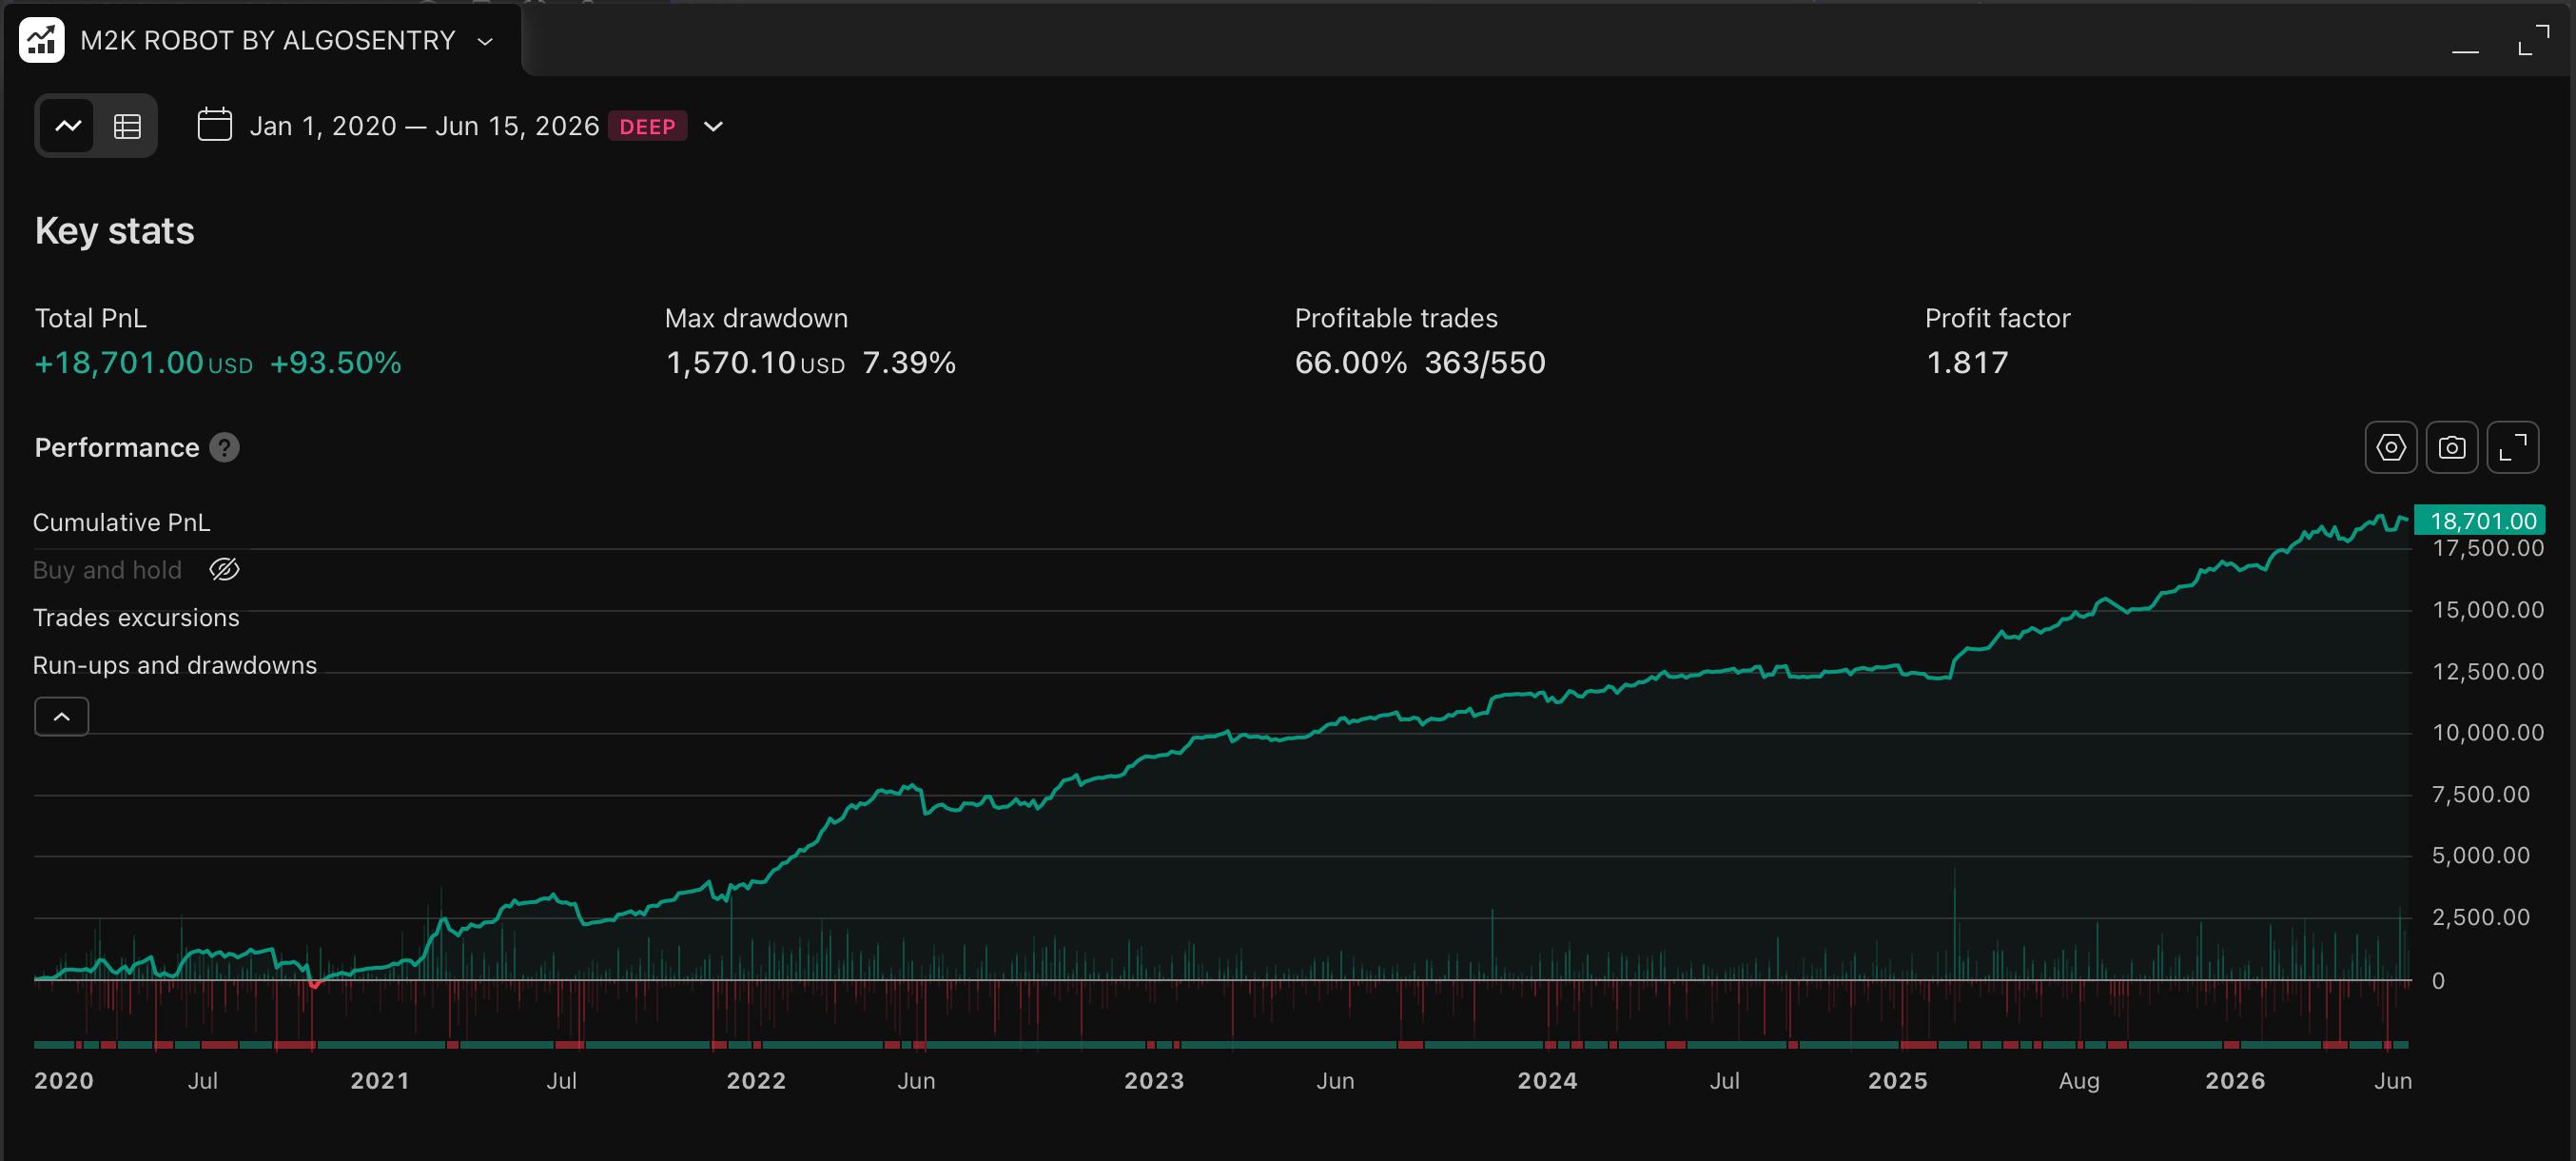
The full 2020–2026 run — straight through COVID and the 2022 bear. Worst drawdown just 7.39%. Russell itself was nearly flat; the robot still climbed.
Hypothetical backtest results · TradingView · DEEP mode · 1 contract · $20K · commissions & slippage included · past performance is not indicative of future results
The robots are built to grow with you.
The backtests above hold size flat at one contract — on purpose, to stay honest. But the systems add size as the account grows. On the exact same 2023–2025 results, here's flat vs. letting it scale:
Same trades, same period (2023–2025). Letting it compound roughly doubled the return — and the mechanism is built in, nothing for you to manage.
Hypothetical scaling model on historical backtest results · not a projection · past performance is not indicative of future results
Two robots that balance each other.
Nasdaq and Russell rarely struggle at the same time — their returns move almost independently (correlation just 0.07). Run together, their profits add, but their drawdowns don't. The second robot's risk is almost entirely absorbed.
Profits add up
Each robot's gains stack — the two track records combine into one curve (the chart above).
Drawdowns don't
They rarely fall at the same time, so the combined drawdown stays near the larger single one — not the sum of both.
A smoother ride
The pair's return-to-drawdown beats either robot alone — the closest thing to a free lunch in markets.
Hypothetical combined backtest · drawdown subadditivity from low correlation between the two markets · not indicative of future results
What the big indicator brands
won't show you.
The popular indicator shops have hundreds of scripts and millions of followers — and not one of them shows you a drawdown or a free trial. Here's the difference, line by line.
Comparison reflects publicly observable practices · AlgoSentry attributes are evidenced on this page
Twelve robustness tests.
Twelve passed.
Most indicators are tuned once on old data and sold. Ours run a 12-test institutional gauntlet — over 13,500 optimization experiments per engine — before a single one ships. Anything that smells of curve-fitting is killed.
Then cross-validated trade-for-trade on Python · TradingView · TradeStation (96%+ match). Methodology grounded in Bailey & López de Prado (2014) · Pardo (2008) · GIPS, CFA Institute.
Running within 24 hours.
Sign up
Send your TradingView username. Within 24 hours you're added as an Invited User to the scripts.
Add to chart
TradingView → Indicators → Invite-Only. 30 seconds and they're on your chart.
Set alerts
Get notified (mobile / email) when conditions appear. You decide what to do — independently.
Start free. Keep what earns it.
Both robots — Nasdaq + Russell — in one subscription. Founding members lock $149/mo for life; new members move to $199 after launch. Cancel anytime before the trial converts.
- Both robots — Nasdaq (1-min) + Russell (30-min)
- The pair that balances itself — lower combined drawdown
- Full 6-year backtests · every year green
- Invite-only TradingView access
- Founding rate locked for life — new members pay $199 after launch
- 7-day free trial · cancel anytime
Founding-member rate · 7-day free trial · add a card, cancel before it converts · educational analysis only — no execution, no managed accounts.
Two robots. Six years.
Every year green.
Add them to your own chart and watch them work — free for 7 days. If they're not what the backtest says, cancel before it converts. The risk is ours to prove.
Start Your 7-Day Free Trial →Invite-only access · running within 24 hours · cancel anytime
Questions, answered plainly.
Were these only tested in a bull market?
No — that's the whole point. The backtest runs from January 2020 through 2026, which includes the COVID crash of 2020 and the 2022 bear market. Both of those years closed in profit. A bull-only track record is exactly what we're built to expose, so we don't ship one.
Do these repaint?
No. Signals are confirmed on bar close only — what you see in the backtest is what was there in real time. Parameters are locked, and there's a hard stop-loss on every trade (the largest single loss is capped, not open-ended). One position at a time — no grid, no martingale.
Why show the drawdown?
Because it's the number that decides whether a strategy is survivable. A return you can't psychologically hold isn't a return you'll ever realize. Every backtest here shows its worst peak-to-valley loss in the same frame as the profit.
Why two robots instead of one?
Nasdaq and Russell rarely draw down at the same time, so running both gives a smoother combined equity curve than either alone — the pair's return-to-drawdown is better than either robot on its own. Profits add; drawdowns largely cancel.
Are these signals or advice?
Neither. They are educational technical-analysis tools that highlight conditions on your chart. No execution, no managed accounts, no investment advice. You decide what to do, independently. AlgoSentry is not a registered investment advisor.
What does the free trial include?
7 days of full invite-only access. You add a card to start and can cancel anytime before it converts — verify the access and watch the robots behave on your own chart first.